


It’s no secret that a mere second of delay in website loading can lead to a sharp drop in conversions. Remember the last time you anxiously waited for a web page to load? The frustration was almost palpable. For developers and businesses, this isn’t just about user experience; it’s about reputation, search engine rankings, and ultimately, the bottom line.
Enter website performance monitoring tools, with Pingdom being one of the most renowned names in the game. But what if you’re looking for something different? Whether you desire unique features, better pricing, or simply a fresh interface, this article dives deep into the best Pingdom alternatives that are taking website monitoring to the next level.
What is website performance monitoring?
Website performance monitoring is all about keeping an eye on how your website is doing. We’re talking about speed, uptime, user experience, and other metrics that can either make or break a visitor’s time on your site. Think of it like a health check-up but for your website. If something’s off—like your site takes forever to load or worse, goes down—you’ll know right away.
It’s more than just clicking refresh on your homepage. Specialized tools dig deep into your website’s performance, checking everything from server response times to individual page elements. These tools can alert you the moment something goes south, allowing you to jump in and fix problems before they escalate.
So, why does this matter? Simple. A well-performing website keeps your audience happy. Happy visitors are more likely to stick around, explore, and eventually, convert into loyal customers or subscribers. It’s not just about avoiding downtime; it’s about providing the best possible experience for anyone who lands on your site.
We’ll be looking at key features, pricing, and other important tidbits for each platform.
Let’s get the ball rolling.
Site24x7
Site24x7 is a comprehensive, all-in-one monitoring solution that offers website uptime and performance monitoring. This robust tool provides deep insights into your website’s health and performance, ensuring you’re always aware of any issues that might impact user experience or overall site functionality. By providing real-time analytics and detailed reports, Site24x7 empowers businesses to maintain optimal website performance and deliver a seamless user experience.
The tool is designed to monitor not just websites but also servers, networks, applications, and real user experience across cloud-based or on-premises platforms. By offering an integrated approach to IT operations management, Site24x7 helps businesses proactively identify and resolve issues before they impact end users.
Key Features
- Website Uptime Monitoring: This feature allows you to track the availability of your website from over 110+ locations globally.
- Performance Monitoring: Site24x7 offers in-depth insights into your website’s loading speed, downtime duration, response time metrics etc.
- Real User Monitoring (RUM): With RUM, you can understand how real users are interacting with your website. It provides insights into user experience across different geographical locations, browsers, platforms etc.
- Application Performance Monitoring (APM): This feature enables you to monitor the performance of your server-side applications and helps in identifying bottlenecks.
One of the reasons why I consider Site24x7 as one of the best tools is its capability to provide a unified view of IT operations. During my usage of this tool for monitoring a client’s e-commerce platform, I found its alerting system particularly impressive.
The alerts were instant and accurate which helped us in proactive issue identification and resolution. The tool was also able to handle the complexity of our client’s infrastructure which included multiple servers spread across different geographical locations.
Pricing
Site24x7 offers four pricing tiers:
- Starter Pack at $9 per month
- Pro Pack at $35 per month
- Classic Pack at $89 per month
- Enterprise Pack at $225 per month
Each tier offers varied levels of features with the enterprise pack offering comprehensive features for large scale businesses.
Uptrends
Uptrends is a powerful website performance and uptime monitoring tool that stands as a robust alternative to Pingdom. As its name suggests, Uptrends is all about helping you keep your website’s performance on an upward trend. It offers a comprehensive suite of monitoring tools that provide real-time insights into your website’s performance, availability, and functionality from over 220 checkpoints worldwide.
The platform is designed to ensure you’re the first to know when your site experiences downtime or performance issues. It does this through advanced synthetic monitoring, which simulates visitor interactions with your website or web application to identify potential problems before they affect your users. Uptrends provides detailed reports and interactive dashboards that make it easy to analyze data and make informed decisions about your site’s performance.
Key Features
- Website Uptime Monitoring: Uptrends checks the uptime of your website every minute from multiple global locations to ensure it’s always accessible to users.
- Advanced Synthetic Monitoring: This feature emulates user interactions with your site or application, helping you identify potential issues before they impact your users.
- Real User Monitoring (RUM): RUM provides insights into how real users are experiencing your site, including details like load time, browser used, and geographic location.
- API Monitoring: Uptrends lets you monitor the availability and performance of your APIs, ensuring they’re working correctly and efficiently.
I’ve found Uptrends to be one of the most reliable tools for keeping tabs on my websites’ performance. While many similar platforms offer uptime monitoring or synthetic monitoring separately, Uptrends combines these features in one intuitive interface.
What sets it apart for me is its commitment to providing actionable data. Instead of merely alerting me when something goes wrong, it helps me understand why it happened so I can prevent similar issues in the future.
Pricing
Uptrends offers four pricing tiers:
- Starter: $15.77/month
- Premium: $35.29/month
- Professional: $180.53/month
- Business: Custom pricing
Each tier offers different features and capabilities tailored to various business needs and sizes.
Dynatrace
Dynatrace is a powerful, AI-powered, full stack advanced performance monitoring tool that provides deep operational insights into your application environment. With its robust features and user-friendly interface, Dynatrace stands out as one of the best alternatives to Pingdom for website performance monitoring. This tool is designed to help businesses monitor their software environments, troubleshoot potential issues and optimize application performance.
Dynatrace’s capabilities go beyond simple website performance monitoring. It offers a comprehensive suite of features that provide real-time analytics, cloud automation and AI-assistance to ensure optimal performance across all layers of your technology stack. Whether you’re a small business or a large enterprise, Dynatrace gives you the tools you need to understand your software environment like never before.
Key Features
- AI-Powered Diagnostics: Dynatrace uses artificial intelligence to automatically identify and diagnose problems in your software environment.
- Full Stack Monitoring: This tool provides visibility across all layers of your technology stack, including applications, infrastructure and cloud environments.
- Real-Time Analytics: Dynatrace offers real-time analytics that help you understand how your applications are performing in live environments.
- Cloud Automation: With its cloud automation capabilities, Dynatrace allows you to automate routine tasks and improve efficiency in your operations.
Dynatrace’s strength lies not only in its powerful features but also in its ability to provide actionable insights. I have personally used this tool for several projects and have found it extremely helpful in identifying bottlenecks and optimizing application performance. The AI-powered diagnostics feature has saved me countless hours by automatically identifying issues that would otherwise take a long time to diagnose manually.
Moreover, the real-time analytics provided by Dynatrace have proven invaluable in understanding how our applications perform under different conditions. These insights have allowed us to make informed decisions about resource allocation and capacity planning.
Pricing
Dynatrace offers several pricing options depending on the size of your organization and specific needs. You can choose from three main plans: Full-stack Monitoring (starting at $69 per host/month), Infrastructure Monitoring (starting at $21 per host/month), or Digital Experience Monitoring (custom pricing). They also offer a free trial for users who want to test out the platform before committing.
New Relic
New Relic is a powerful performance monitoring platform that delivers real-time analytics for web and mobile applications. This platform provides developers, IT professionals, and business leaders with the insights they need to deliver high-quality software, improve customer experiences, and drive business outcomes.
With a robust suite of tools for application performance management (APM), infrastructure monitoring, digital experience monitoring (DEM), and log analytics, New Relic enables teams to visualize, analyze, troubleshoot, and optimize their entire software stack all in one place.
As the name suggests, New Relic’s real-time analytics capabilities are at the heart of what sets this platform apart. Users can track key performance indicators (KPIs) in real time, identify anomalies as they occur, and drill down into granular data for root cause analysis. This real-time visibility extends across all layers of the software stack – from the user interface to the underlying infrastructure – providing a comprehensive view of system health and performance.
Key Features
- Real-Time Analytics: Monitor application performance in real time with detailed metrics on throughput, response time, error rate, and more.
- Full-Stack Observability: Gain visibility into every layer of your software stack – from front-end UI to back-end databases.
- AI-Powered Anomaly Detection: Use New Relic’s AI capabilities to automatically detect anomalies in your data and trigger alerts.
- Flexible Dashboards: Create custom dashboards to visualize your data in ways that make sense for your team.
New Relic is one of the best platforms you can get your hands on. The reason is not just because it offers comprehensive features but also due to its intuitive user interface and seamless integration capabilities which make it very user-friendly.
Pricing
New Relic offers several pricing options designed to fit different needs:
- Essentials Plan: Starting at $23 per month per host; includes basic APM features.
- Pro Plan: Starting at $149 per month per host; includes advanced APM features plus additional capabilities like distributed tracing.
- Enterprise Plan: Custom pricing; includes all Pro features plus business-wide insights with unlimited data retention.
AppDynamics
AppDynamics, a part of Cisco, is a comprehensive application performance and business monitoring platform designed to help businesses proactively monitor, troubleshoot, and optimize their digital experiences. With its real-time performance insights and end-user monitoring capabilities, AppDynamics provides businesses with the visibility they need to deliver high-performing applications and ensure seamless digital experiences for their users.
Whether you’re running applications in the cloud, on-premises, or in hybrid environments, AppDynamics equips you with actionable insights into your application performance. It helps you understand how application performance impacts your business outcomes and enables you to make data-driven decisions.
Key Features
- Business Performance Monitoring: AppDynamics aligns IT performance with business objectives by correlating application performance data with key business metrics.
- End-User Monitoring: Provides visibility into every user journey across multiple channels to help identify and resolve user experience issues.
- Application Performance Management: Offers real-time insights into application performance for quick issue detection and resolution.
- Infrastructure Visibility: Monitors the entire IT infrastructure including servers, databases, containers, and networks.
It’s not just about monitoring server health or network latency; AppDynamics goes beyond that by providing deep insights into how your applications are performing from a business perspective. For example, I once worked on a project where we used AppDynamics to identify bottlenecks in an e-commerce application during peak shopping periods. By correlating this data with business metrics like sales revenue and customer churn rate, we were able to prioritize our optimization efforts based on their potential impact on business outcomes.
Pricing
AppDynamics offers flexible pricing options that cater to different needs. They offer a free tier for small teams starting out with APM (Application Performance Monitoring). For larger businesses or those needing more advanced features such as Business iQ or End User Monitoring, pricing is quote-based depending on specific requirements.
Datadog
Datadog is a leading cloud-based infrastructure and application performance monitoring tool that has revolutionized the way businesses manage their IT operations. This innovative software is designed to provide real-time insights into your systems, applications, and services, enabling you to quickly identify and resolve issues before they impact your business outcomes. With Datadog, you can monitor your entire infrastructure – whether it’s on-premises, in the cloud, or a hybrid environment – in one place.
The strength of Datadog lies in its comprehensive visibility into modern environments, including metrics from servers, databases, tools, and services. It helps businesses analyze the performance of their applications across different platforms and troubleshoot issues efficiently. This powerful tool provides actionable insights that help businesses optimize their operations, improve user experiences, and drive better business decisions.
Key Features
- Real-Time Dashboards: Datadog offers customizable dashboards that display real-time data about your applications and infrastructure.
- Full Stack Observability: This feature allows you to trace requests from end-to-end across distributed systems.
- AI-Powered Alerts: Datadog provides intelligent alerting capabilities that notify you of performance anomalies or errors in real-time.
- Integration Capabilities: The tool supports integration with a wide range of popular technologies including AWS, Google Cloud Platform, Microsoft Azure, Slack and more.
One thing that sets it apart is its intuitive user interface which makes navigating through complex data a breeze. Additionally, it has an impressive scalability factor. Whether you’re monitoring 10 servers or 10 thousand servers – Datadog performs consistently without any hiccups.
Pricing
Datadog offers three pricing tiers based on your needs:
- Free: For users who want to explore the basic features.
- Pro: Priced at $15 per host per month for advanced features like anomaly detection.
- Enterprise: Custom pricing for large-scale businesses needing premium features like machine learning-based alerts and forecasting capabilities.
LogicMonitor
LogicMonitor is a premier SaaS-based performance monitoring platform for IT infrastructure. It’s a comprehensive tool that provides end-to-end visibility into the health and performance of your entire IT stack, from networks to servers, applications, storage, and cloud resources. The platform is designed to be easy to use and scalable, catering to businesses of all sizes across various industries.
As a SaaS-based solution, LogicMonitor offers the advantage of easy setup with no hardware requirements. It can be quickly deployed in any environment and offers real-time insights into your infrastructure’s performance. This enables teams to proactively identify issues before they impact service delivery, ensuring optimal performance and uptime.
Key Features
- Automated Device Discovery: LogicMonitor can automatically discover all devices in your network and add them to the monitoring system.
- Performance Forecasting: The platform uses advanced algorithms to predict future performance trends based on historical data.
- Alerting & Reporting: Get real-time alerts on critical issues and comprehensive reports on the health status of your IT infrastructure.
- Cloud Monitoring: Monitor the performance of cloud resources alongside on-premise infrastructure in a single dashboard.
What sets LogicMonitor apart is its automation capabilities. Unlike other tools where you need to manually configure each device for monitoring, LogicMonitor does this automatically. This not only saves time but also ensures that no device is left unmonitored. Furthermore, it consistently updates its library with new technologies without requiring manual intervention.
Another aspect that impressed me was LogicMonitor’s customer support. They provide 24/7 assistance with a team of experts who are always ready to help you troubleshoot any issues or answer queries about the platform.
Pricing
LogicMonitor operates on a subscription-based pricing model which varies based on the number of devices you want to monitor. They offer three plans: Starter, Pro, and Enterprise. For detailed pricing information, it’s best to contact their sales team directly as they customize pricing according to individual business needs.
ManageEngine Applications Manager
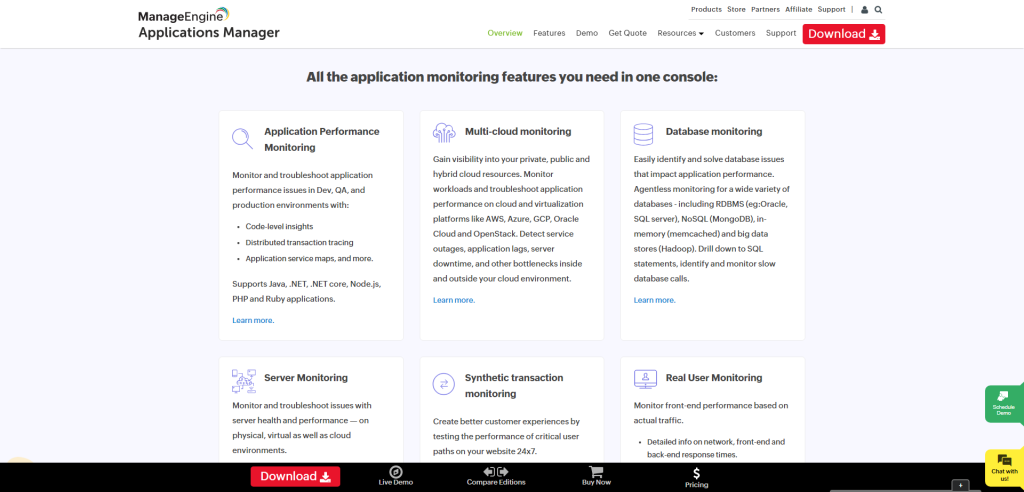
ManageEngine Applications Manager is an all-inclusive Application Performance Management (APM) solution that helps businesses ensure their critical applications and servers are constantly available and performing optimally. The software provides deep-dive performance monitoring for a wide array of applications, databases, servers, services, and more, providing IT teams with the insights they need to proactively manage their IT infrastructure.
With ManageEngine Applications Manager, businesses can monitor their entire application ecosystem in real-time, identify performance issues before they affect end-users, and troubleshoot problems quickly with actionable insights. The platform supports over 130 technologies across physical, virtual, and cloud environments.
Key Features
- Comprehensive Application Monitoring: Monitor a wide array of applications including web applications, web servers, application servers, databases, and systems.
- Anomaly Detection: Use machine learning to detect anomalies in your application performance data.
- Code-level Diagnostics: Identify slow transactions with tracing at the code level.
- Capacity Planning: Analyze capacity trends and plan your resource needs accordingly.
One of the key strengths of ManageEngine Applications Manager is its ability to provide a unified view of enterprise IT resources. For example, while working on a project that involved monitoring multiple databases alongside various web services spread across different geographical locations, I could easily track all these components from one dashboard. This made it incredibly easy to identify bottlenecks and address them promptly without having to switch between multiple tools.
Pricing
ManageEngine Applications Manager offers flexible pricing options based on the number of monitors required. It starts from $945 for up to 25 monitors. They also offer an Enterprise edition priced at $9,595 for up to 500 monitors. A free version is available for small businesses or those who want to try out the software before purchasing.
Summary
So there you have it, stepping outside the Pingdom bubble opens up a world of possibilities. Each alternative brings its own set of features, strengths, and pricing models to the table. The key is to pinpoint what matters most for your website’s needs, whether it’s advanced analytics, affordability, or user-friendly design.
Switching to a new platform might feel like a big leap, but consider it an investment in your site’s long-term health. Sometimes a fresh perspective—or in this case, a new tool—can offer solutions you didn’t even know you needed. It’s all about ensuring that your website runs smoothly, keeping both you and your audience happy.