


API monitoring is critical in today’s world of software development as APIs have become a vital part of modern applications. Ensuring their reliability and performance is essential to prevent issues such as application downtime, slow performance, and loss of revenue.
To achieve this, API monitoring tools are used to monitor APIs for issues related to uptime, performance, response time, error rates, authentication, authorization, and data accuracy. These tools are useful for monitoring potential issues and providing detailed analytics and reports to help them understand how APIs are being used and identify potential problems.
This article will explore the top API monitoring tools and how they can help you ensure your APIs’ optimal performance and reliability.
How do API monitoring tools work?
API monitoring tools serve as the watchdogs of the software world, ensuring that Application Programming Interfaces (APIs) are performing as they should. These tools routinely send requests to APIs and receive responses, just like a user or another system would. The primary objective? To verify that an API is available, functional, and meeting performance benchmarks.
Now, what do these tools actually look for? Typically, they keep tabs on several key metrics:
- Availability: Is the API up and running?
- Response Time: How long does it take for the API to respond?
- Rate Limiting: Are there any imposed limits on how many requests can be made in a given timeframe? Are these limits being adhered to?
- Data Transfer: How much data is being sent or received during an API call?
- Error Rates: Are the API calls completing successfully, or are errors being thrown?
These metrics provide a sort of “health check” on the API. They allow developers and system administrators to understand how well the API is functioning and where bottlenecks or issues may exist. Moreover, many monitoring tools can alert you if something’s amiss, sparing you the midnight wake-up call to a system in flames.
To achieve this, API monitoring tools use various methods. Some employ simple HTTP requests to interact with RESTful APIs, while others might use more complex scripts for SOAP or GraphQL APIs. These requests can be scheduled at regular intervals or triggered based on specific events. Data gathered during this process is then compiled into reports, often displayed on a dashboard for easy consumption. From there, one can identify patterns, or lack thereof, and make informed decisions about any required changes or upgrades.
So, how does all of this data actually help? Imagine running a high-traffic e-commerce site. Your API is the linchpin connecting the front-end shopping experience to the back-end inventory system. If that API slows down or fails, it’s not just a technical issue; it’s a business problem. Knowing what’s wrong as soon as possible allows for quicker resolution, minimizing potential damage.
In a nutshell, API monitoring tools act like the pulse checkers of your software ecosystem. They keep your APIs in line, making sure they’re performing their designated roles effectively. Would you ignore signs of ill health in your own body? Probably not. And that’s why you shouldn’t ignore them in your APIs either.
Checkly
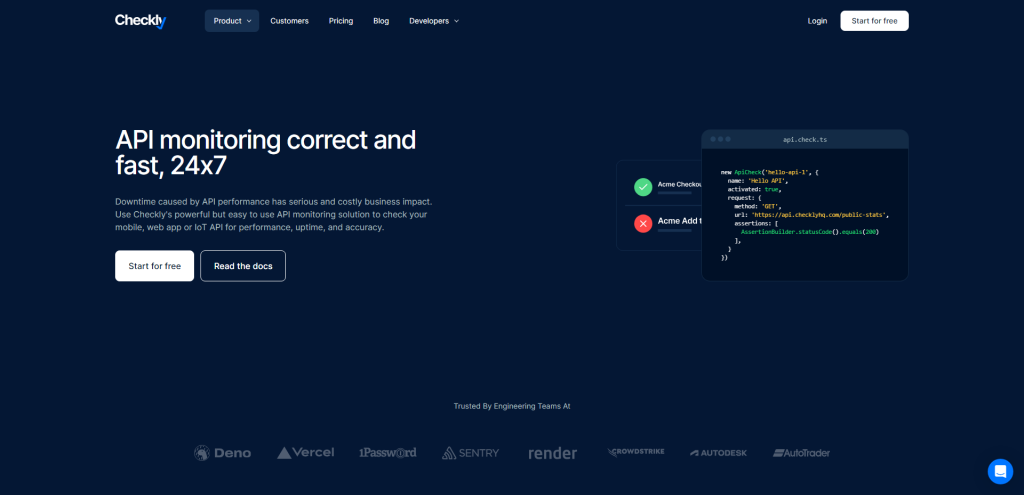
Checkly is a cloud-based API monitoring and end-to-end testing platform that enables developers and DevOps teams to monitor their APIs and web applications with ease. With a suite of features including API monitoring, browser monitoring, uptime monitoring, and incident management, Checkly offers a comprehensive solution for ensuring the optimal performance and reliability of web applications.
What’s great about Checkly is that it allows you to create custom tests using JavaScript, so you can closely match your application’s unique needs. Plus, it has a global network of servers that lets you test from different parts of the world, which is super helpful if you have users in different locations.
Checkly’s API monitoring solution provides the following features:
- Monitoring for performance. Checkly records response times for each request, including TCP, DNS, and first byte times. Developers can add assertions for maximum response time.
- Monitoring for correctness. Check payloads, return codes, headers, and authentication. Developers can dive into JSON payloads and validate specific items.
- High-frequency global monitoring. Monitor APIs every 10 seconds from 20 global data center locations.
- Setup and teardown scripts. Run custom JavaScript before and after API checks. Sign requests, get auth tokens and clean up test data.
- Import from tools you know. Checkly’s cUrl and Swagger API importers create fully fledged API checks with just a few clicks.
- CI/CD integration. Integrate API monitoring into QA or continuous delivery processes by triggering ad hoc runs from GitHub or the command line.
- Customizable alerting. Add Slack, SMS, email, or Pagerduty for timely and actionable insights when a check fails. Developers can also use webhooks for full access to JSON data for alerting.
- Global coverage. Checkly’s monitoring tool provides visibility for private applications across private or hybrid cloud infrastructure. Run checks from 20 data center locations worldwide.
Checkly also has some really handy integrations with tools like Slack, PagerDuty, and Datadog, so you can easily incorporate monitoring into your existing workflow.
Pricing: Checkly has three pricing plans: Hobby (free), Team (starting at $30/month), and Enterprise (custom).
Prometheus
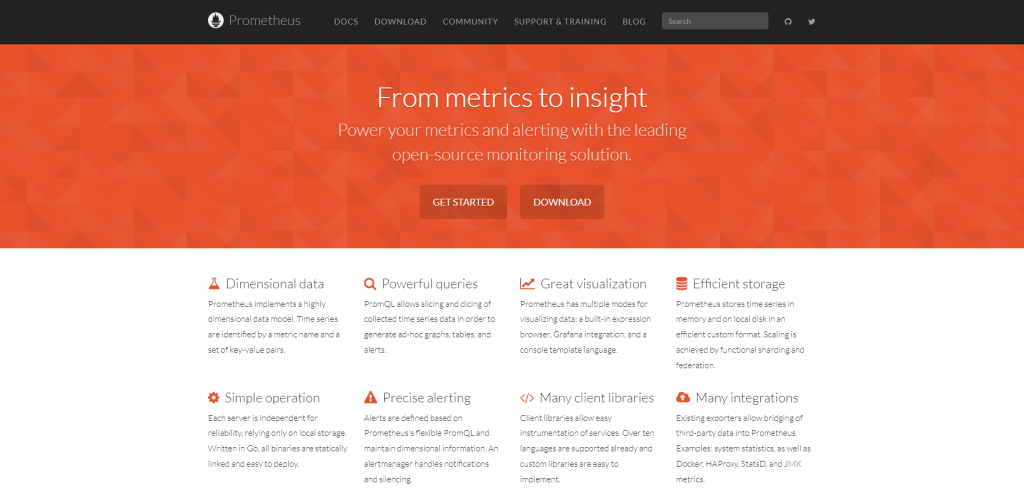
Prometheus is an open-source monitoring and alerting system that was created by SoundCloud in 2012. It is designed to monitor the performance and health of systems and applications, particularly in cloud-native environments.
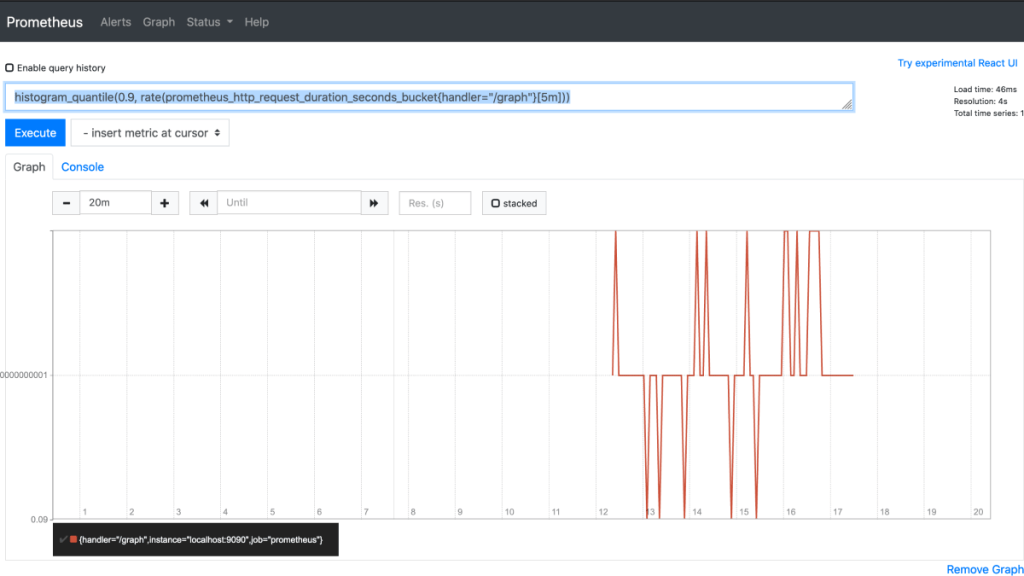
What makes Prometheus different from other monitoring systems is its multi-dimensional data model, which includes a time series defined by a metric name and a set of key/value dimensions. Prometheus also offers PromQL, a powerful and flexible query language that leverages this dimensionality.
Unlike some monitoring systems, Prometheus doesn’t rely on distributed storage, meaning each server node is autonomous. It uses an HTTP pull model for time series collection, but pushing time series is supported via an intermediary gateway for batch jobs. Targets are discovered through service discovery or static configuration.
Prometheus offers multiple modes of graphing and dashboarding support, as well as hierarchical and horizontal federation. Overall, it’s a powerful and flexible monitoring tool designed for cloud-native environments that offers unique features such as its data model and PromQL query language.
Many organizations use Prometheus for monitoring and alerting in conjunction with other tools such as Grafana for visualization, Kubernetes for container orchestration, and Checkly for API monitoring.
Graphite
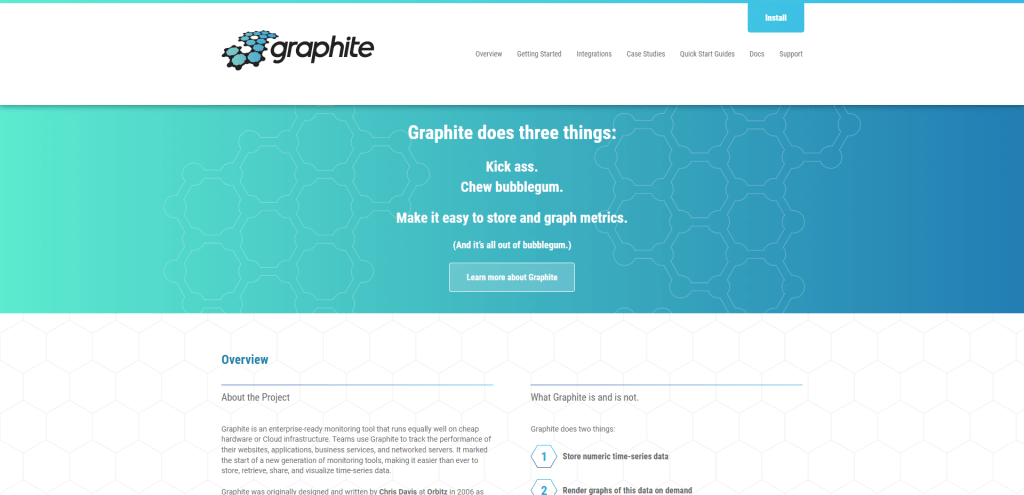
Graphite is an open-source, highly scalable real-time graphing system that is designed to store and render numeric time-series data on demand. It consists of three software components: carbon, whisper, and the Graphite webapp.
Carbon is a Twisted daemon that listens for time-series data, while whisper is a simple database library for storing time-series data. The Graphite webapp is a Django webapp that renders graphs on-demand using Cairo.
Graphite is a fault-tolerant and horizontally scalable tool that can handle high volumes of data and is widely used by many large companies, including Reddit.
The system supports a variety of data sources and includes a powerful query language, known as the Graphite Query Language (GQL), which allows users to query and analyze data in a flexible and customizable way.
Best of all, Graphite scales horizontally on both the frontend and the backend, meaning you can add more machines to increase throughput.
Uptrends
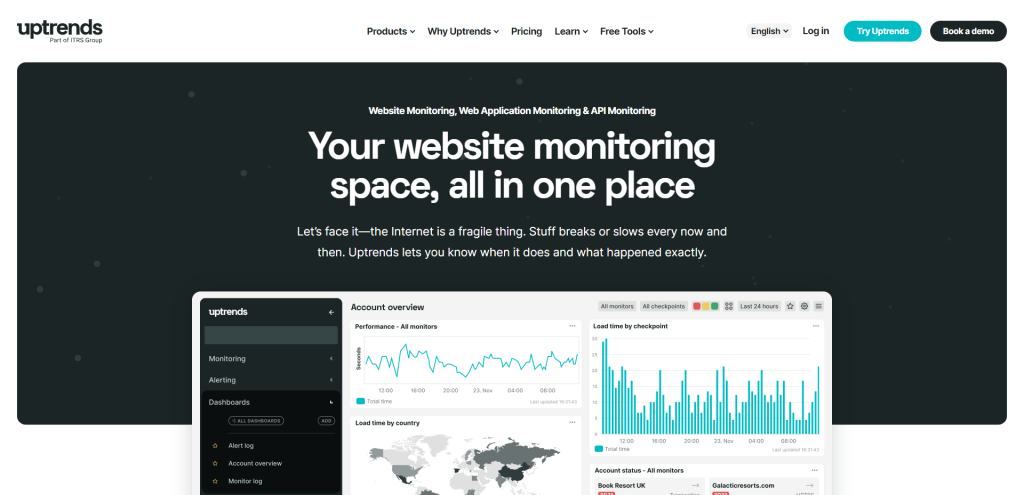
If you’re looking for a platform to monitor the uptime and performance of your website, you might want to check out Uptrends. It’s a website monitoring and web performance optimization tool that offers a range of solutions for web, API, and transaction monitoring.
One of the coolest things about Uptrends is that it allows you to monitor your website from multiple locations around the world. That means you can get a comprehensive view of your website’s performance and make sure it’s accessible to users no matter where they are.
Some of the API monitoring features that Uptrends provide includes:
- Multi-step API Monitoring. Check your APIs for performance, function, and uptime. Test your APIs from top to bottom by setting up multiple HTTP requests.
- Dashboard monitoring. Overview of performance, load times, uptime, and errors. Keep your APIs up and functioning 24/7.
- Performance Monitoring. Check the performance of every request, and set assertions for maximum response times. Spot trends in your performance dashboards.
- Functionality Verification. Test redirects, authentication, perform CRUD, or any other API interaction. Monitor for result codes, and check if your API returns expected content.
- Global Testing. Monitor your APIs from 233 global checkpoints. Use Concurrent Monitoring to test from several locations simultaneously.
- Immediate Alerting. With tests as frequent as every minute, get alerts and escalations from Uptrends the moment your API is in trouble.
Uptrends is also really user-friendly. It offers an all-in-one solution for website monitoring, including the ability to test website uptime and performance, receive alerts for website and server issues, and diagnose problems quickly. The platform also includes features for synthetic monitoring, real user monitoring, and server monitoring.
One of the best things about Uptrends is that it provides an easy-to-use dashboard that displays all monitoring data in one place. That makes it simple to manage and analyze your website’s performance.
You can view detailed reports on website uptime, load times, and server response times, and receive real-time alerts when issues arise.
Pricing: Uptrends offers different plans for its monitoring services, with prices ranging from $17.50 per month for the Starter plan up to custom pricing for the Enterprise plan. They also offer a free 30-day trial with no limitations and no credit card required. Customers can save 10% by choosing a yearly subscription plan.
Sauce API Quality
Sauce Labs offers API testing services (formerly API Fortress) as part of its application testing services on its cloud platform. This tool is beneficial to development teams who are working on APIs or applications integrating APIs.
Here are the key features of Sauce Labs API Testing:
- Cloud-based tool that tracks and checks underlying microservices
- Integrates with CI/CD pipelines and project management tools
- Suitable for agile development scenarios
- Offers manual testing and automated testing, including device-based automated testing
Sauce Labs API Testing allows teams to create new test scenarios using its Test Composer. It also supports test cases from other systems such as Swagger, OpenAPI, and Postman Collections. This tool can be integrated with other development lifecycle support tools in the cloud or on-premise, and it can continuously test APIs from development to operations.
This tool offers both manual and automated testing capabilities. Manual testing is ideal during API development, while automated testing is best for production environments. The device-based automated testing feature is helpful for acceptance testing by Web application buyers or IT operations teams to ensure the system works properly on various devices.
Pros:
- Continuous testing from development through to operations
- Identifies and tests supporting microservices
- Integrates with other project management tools
- Offers centralized cloud-based platform
Cons:
- No self-hosted option
Sauce Labs provides a simple user interface for professionals and beginners to easily learn. It offers load testing, functional testing, and automation testing on REST and SOAP APIs. It also provides monitoring capabilities, which enables the program to continuously run unlimited tests and alert users when there are problems. Results data are stored on its servers and won’t affect app performance.
Pricing: Sauce Labs offers a free plan with 2,000 credits per week, which allows you to run tests on up to 10 devices in parallel. Their monthly plan costs $50 per month and includes 25,000 credits per month to run Automated and Live Tests on up to 25 devices in parallel.
Summary
API testing is an essential aspect of building secure and functional software applications. However, finding a trustworthy tool can be challenging. That’s why we’ve compiled a list of the best API testing tools, which can help you select the right one for your needs.
The right tools can make the process simpler and more convenient, and many of them offer free trials. API monitoring is critical for any organization that runs its own web services to prevent the loss of functionality and revenue.
Ultimately, the best API monitoring tool depends on your specific needs, including your budget, the type of API you are monitoring, and the level of customization required. Understanding the unique features and capabilities of each tool allows you to choose the one that best suits the needs of your organization/project.