

I’ve been working with Chrome for over a decade now, long before Mozilla managed to fix their memory leak issues. And, as someone who does front-end development on a daily basis, I’ve also been an avid user of the Chrome DevTools. Whether it’s to do the most basic form of inspecting CSS or doing performance tests, DevTools is an indispensable part of my routine as a developer.
And over the years I have both learned but also collected various tips and tricks, some of which aren’t exactly clear-cut. If you want a refresher on everything that DevTools can do, I recommend referencing the official documentation. But more importantly, the What’s New in DevTools page, since that’s where you’ll get all the new features and tools at a glance.
The best way to browse this resource is either to CTRL+F and look for “keywords” that interest you or you can also toggle the Table of Contents above and then jump to a specific example directly. I’m sure this page will grow over time as I learn new things, so feel free to bookmark this page for future reference. Let’s kick things off with something practical but very much useful.
Block resources to render site without CSS/JavaScript
We take JavaScript for granted, but there are plenty of people who block JS in their browser, with most doing for reasons relating to accessibility, privacy, and security.
And you also have to consider cases where JS/CSS might not be accessible due to network problems, or the browser failing to fetch a particular resource. So, what does your website look like when a particular file/library is blocked?
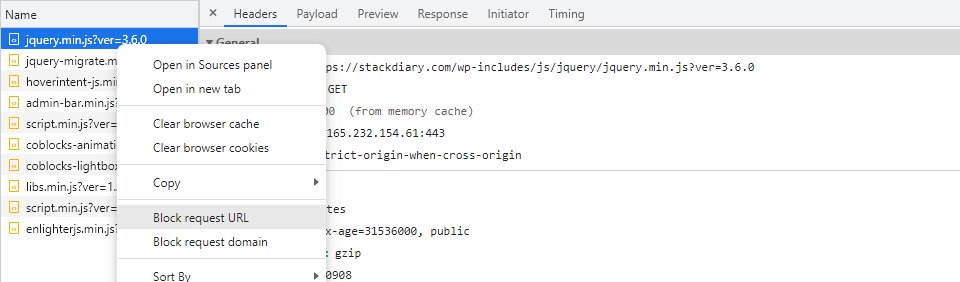
- Open up DevTools and go to the Network tab.
- Reload the page you’re on to fetch all the resources.
- Click on any resource and select Block resource URL.
- Refresh the page again to see the result.
I do believe this also works inside Firefox and Edge developer tools.
CSS Changes at a glance (with Export)
Have you ever gotten carried away with changing CSS from DevTools only to realize you now have to backtrack to 10 different properties to save those changes? Yep. Been there, done that.
Thankfully, there is a better way to tackle this problem.
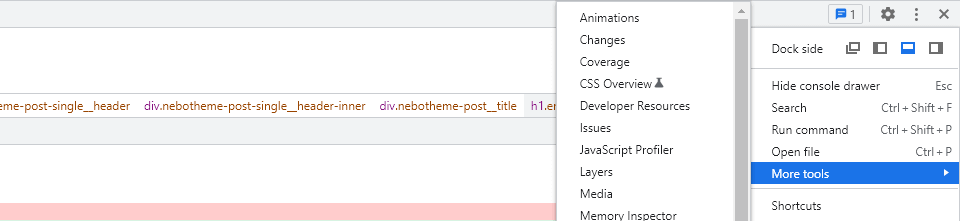
- Go to Customize and control DevTools -> More tools.
- Select Changes.
- A permanent tab will appear inside DevTools showcasing code changes you’ve made.
The Changes panel can also be accessed through CTRL/CMD+Shift+P shortcuts and then typing in Changes in the Run console. At the bottom of the Changes interface, you have a Copy button, which can be used to directly export all the changes you made in that session.
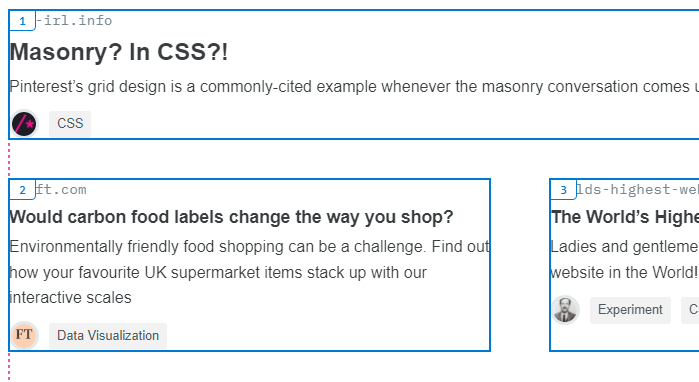
Change Grid & Flexbox layout structure
I recently wrote an article on some of the best CSS layout generators, so this next tip goes hand in hand with that article. First, Inspect any container which is supported by either Grid or Flexbox, and then look for the allocated property that has display: flex; or vice-versa.
Next to the property, you’ll see a small clickable icon (the editor) – clicking on this will open up a panel from within which you can use positioning properties as specified in Grid or Flexbox.
This feature is useful when you want to test a new layout alignment in real-time. There’s also a thing called CSS Grid Inspector, for which the Chrome dev team has done a write-up.
Debugging accessibility with in-built tools
Accessibility is very much a hot topic in front-end developer circles. So much so that the majority of component libraries and UI kits come pre-built with accessibility best practices. CMS platforms like WordPress have also embraced accessibility, and have begun to implement features that prioritize design inclusivity. And DevTools is no exception to the rule.
» Enabling accessibility tree in Chrome DevTools
After you select the enable checkbox, you’ll need to reload your DevTools. At this stage, you’ll have an accessibility icon on the top-right corner in the Elements window. Clicking this icon will reveal the entire site’s structure in a DOM tree view. Then you can inspect individual site sections and elements and see whether they have had an ARIA label assigned to them.
» Source Order Viewer
On the same panel as shown in the GIF above there is another checkbox. And that checkbox is called Show source order. What this does – once enabled – is it lets you see the order in which elements appear for visitors who might visit your pages using assistive tools.
Once enabled, you can select any area of your page and see the order in which items will appear.
This is particularly useful when working with either Grid or Flexbox, both of which have properties for rearranging the display order of items. E.g. order: 1;
» Color suggestions for low contrast text
Color contrast is one of the major accessibility issues, even for people who aren’t necessarily suffering from serious visual impairments. I’ve had cases where my vision was starting to get worse and I needed to get a new prescription for my glasses, and the thing that gave it away was low/high contrast colors making me eyes weary. White on red, green on blue, etc.
The web.dev team has done an entire write-up on how the following method works.
This method works for any on-page element. Even if you think that the contrast is fine, the Contrast ratio algorithm can make subtle suggestions to improve overall contrast visibility.
Format minified JavaScript/CSS into readable code
It only takes a few seconds to import minified code into VS Code and then apply Prettier, but why bother when you can format (unminify) directly from the DevTools console.
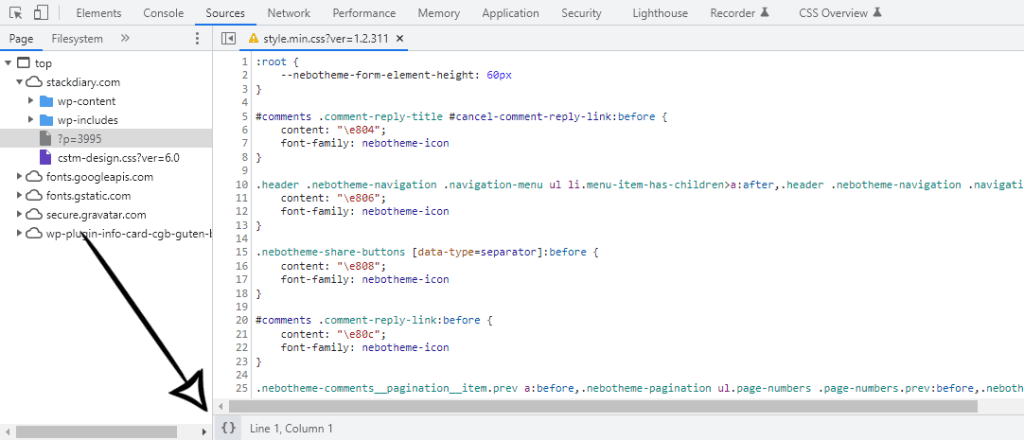
To make this work:
- Open the Sources panel inside DevTools.
- Open any file that’s been minified.
- Click on the { } icon at the bottom of the console.
- Code is now formatted.
Editing (text) and removing elements with designMode
designMode is part of the Web API specification and enables you to directly edit on-page elements, although with some limitations. For example, only text can be edited, but any other element can be removed entirely. Keep in mind this isn’t an “official” feature, but it is nonetheless useful when working with things like CSS math functions and other text-specific properties.
To try it yourself:
- Open up the DevTools Console.
- Type document.designMode=”on” and submit.
- Go back to the page and start editing.
The off property is also applicable when you want to disable designMode. And in case you didn’t notice in the GIF, this works great for doing spellchecks of your on-page content, too.
Capture screenshots from the Device Emulator
This is a feature that had eluded me for the longest time. My usual workflow for taking screenshots is either Snip or Awesome Screenshot extension. As it turns out, you can capture Mobile/Tablet and other resolution screenshots directly from the Device Emulator.
But, that’s not the only reason this feature is useful. You can in fact capture screenshots including the device frame. Before I get into more details, here is an example:

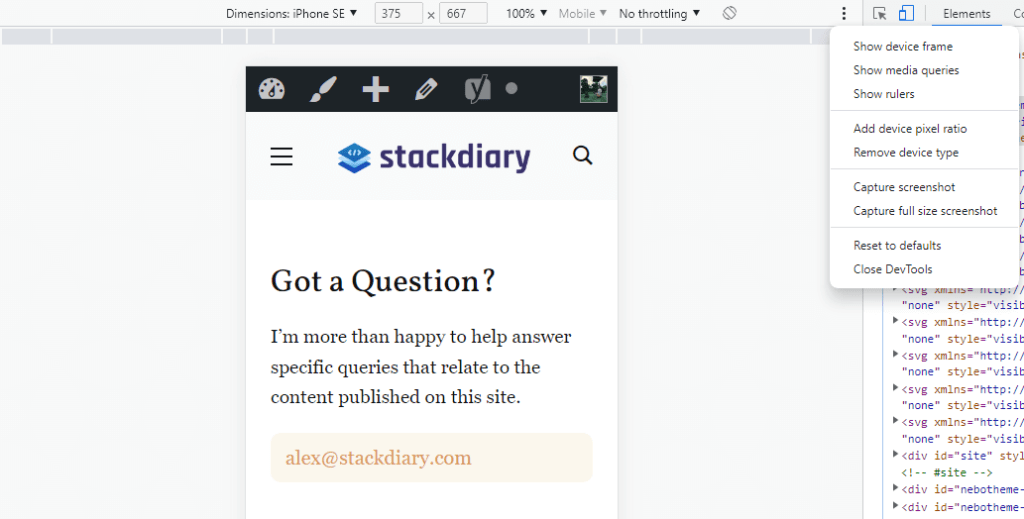
So, how do you enable the device frame for mobile/tablet screenshots?
- Open DevTools.
- Click on the Toggle device toolbar icon.
- Navigate to top-right menu icon (three dots).
- Select Show device frame.
Here is a visual preview:
The problem is, even if you click the button the device frame doesn’t show. And this is because only a handful of devices have the frame displayed. In fact, you will need to manually enable these devices from the menu available in Dimensions -> Edit. These device types have a frame:
- iPhone 5/SE
- iPhone 6/7/8 & Plus
- Nexus 5 & 5x
- Nexus 6P
- iPad
Thanks to StackOverflow user RoCk RoCk for the clarification.
Select colors from outside the browser
This is one of the more recent features added to DevTools. Assuming you’re already familiar with the Color Picker – it is now possible to pick colors that aren’t inside the browser. In other words, you can select colors directly from your desktop, whether it’s an image or a specific icon.
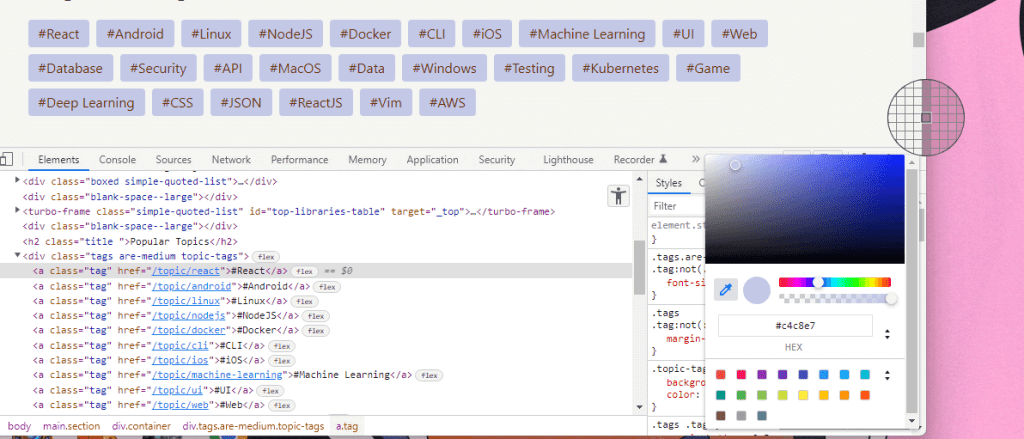
Now you can grab the colors from your favorite photos even quicker.
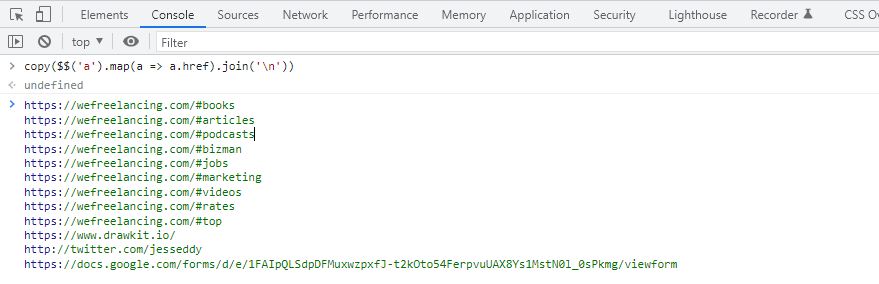
Use copy() as a pseudo-scraper
The copy() function can be used to mass-fetch objects found on the page. For me, this is the quickest way to quickly scrape all the URLs found on a page.
In your Console type:
copy($$('a').map(a => a.href).join('\n'))And the result is:
The alternative JavaScript function would look like this:
var link_array = [], l = document.links;
for(var i=0; i<l.length; i++) {
  link_array.push(l[i].href);
}
console.log(link_array)
How to change the Chrome DevTools color theme
I wonder how many devs have changed their Chrome browser theme to dark but didn’t realize you have to do it separately for DevTools. I’m sure there have been a fair few.
With DevTools open you can press F1 to open settings. This will open the default Preferences panel where you can choose from Light or Dark theme, or use System Preferences.
A glimpse inside a development powerhouse
This is by no means an exhaustive list of everything that DevTools can do. And over time I hope to add more interesting tricks that I come across. I hope that at least one or two of these tips were interesting enough for you to add to your notes. And if not, check back later!