
Python has become a go-to language for data science, and for good reason. It’s easy to read, has a vibrant community, and most importantly, it has a plethora of libraries that make data manipulation a breeze.
But with so many options out there, picking the right tools can feel overwhelming. That’s why we’re here today: to walk you through the top Python libraries for data science and analysis.
Whether you’re a seasoned data scientist or someone just getting your feet wet in this field, this list aims to give you a clear picture of what each library does best.
So, let’s get started and explore what Python has to offer for data aficionados like us.
1. Pandas – getting your data ready
Pandas is a powerful open-source library for data manipulation and analysis in Python. It provides a fast, flexible, and easy-to-use data structure called a DataFrame, which is similar to a spreadsheet. With Pandas, you can easily read, write, filter, and transform data from various sources, including CSV files, Excel spreadsheets, SQL databases, and more.
Pandas has several key features:
- Powerful Data Structures: Pandas provides two primary data structures – Series and DataFrame – that can handle various data types and sizes.
- Data Manipulation: Pandas offers various functions and methods for filtering, sorting, transforming, and aggregating data.
- Data Input/Output: Pandas can read data from a variety of sources, including CSV, Excel, SQL databases, and HTML, as well as write data to these formats.
- Time Series Analysis: Pandas has robust support for working with time series data, including date and time parsing, time indexing, and resampling.
- Missing Data Handling: Pandas provides tools for handling missing data, including filtering, filling, and interpolation.
- Merging and Joining: Pandas can merge and join datasets based on common columns or indices.
- Visualization: Pandas provides a simple interface for creating visualizations using Matplotlib.
- High Performance: Pandas is built on top of NumPy, a highly optimized numerical computing library, and provides fast, vectorized operations on large datasets.
- Integration: Pandas integrates well with other data analysis and machine learning libraries in the Python ecosystem, such as Scikit-learn, TensorFlow, and PyTorch.
2. NumPy – high-level calculations
NumPy is a Python library used for numerical computing. It provides support for large, multi-dimensional arrays and matrices, as well as a large collection of high-level mathematical functions, to operate on these arrays. NumPy also provides tools for integrating with other languages and libraries, as well as support for various data file formats.
NumPy is commonly utilized in scientific computing, data analysis, and machine learning. Its support for large, multi-dimensional arrays makes it an ideal choice for handling large data sets and performing complex calculations on them.
Many other libraries and frameworks in the data science ecosystem, such as Pandas, Matplotlib, and Scikit-learn, are built on top of NumPy and rely on it for its core functionality.
Some of the most common use cases for NumPy include:
- Data analysis: NumPy allows for quick and efficient manipulation and analysis of large datasets.
- Linear algebra: NumPy provides a suite of linear algebra functions that can be used for matrix and vector operations, solving linear systems of equations, and computing eigenvalues and eigenvectors.
- Signal processing: NumPy includes functions for signal processing, such as Fourier transforms, convolution, and filtering.
- Machine learning: Many machine learning algorithms, such as support vector machines and neural networks, require matrix operations, which can be efficiently performed using NumPy.
The libraries efficient array operations and mathematical functions make it a go-to choice for numerical computing tasks.
3. SciPy – for complex mathematical calculations
SciPy is an open-source Python library used for scientific and technical computing. It is built on top of the NumPy library and provides a collection of high-level algorithms and functions that are useful in a wide range of scientific domains.
Some of the most common use cases for SciPy include:
- Optimization: SciPy provides a suite of optimization algorithms that can find the minimum or maximum of a function or solve optimization problems.
- Integration: SciPy includes numerical integration functions, which can approximate a function’s integral over a given interval.
- Interpolation: SciPy provides functions for interpolating data, which can be useful for approximating missing data points or smoothing out noisy data.
- Linear algebra: Like NumPy, SciPy provides a suite of linear algebra functions for solving systems of equations, computing eigenvalues and eigenvectors, and performing matrix decompositions.
- Statistics: SciPy includes various statistical functions, such as probability distributions, hypothesis testing, and regression analysis.
SciPy is commonly utilized in scientific computing, engineering, and data analysis. It provides a wide range of functions, such as optimization, integration, interpolation, linear algebra, statistics, signal processing, and more.
4. Matplotlib – for data visualization
Matplotlib is a Python library used for data visualization. It provides a wide range of tools for creating static, animated, and interactive visualizations in Python. Matplotlib is highly customizable, allowing users to create a wide range of visualizations, including line plots, scatter plots, bar charts, histograms, 3D plots, and more.
Some of the most common use cases for Matplotlib include:
- Exploratory data analysis: Matplotlib can be used to quickly visualize and explore data sets to gain insights into patterns, trends, and anomalies.
- Presentation of research findings: Matplotlib allows researchers to present their findings in a clear and concise manner through high-quality visualizations.
- Machine learning: Matplotlib can be used to visualize the results of machine learning algorithms, such as regression models and decision trees, to gain insights into the performance of these models.
- Development of web applications: Matplotlib can be used to create interactive visualizations for web applications using libraries such as Flask or Django.
Matplotlib is commonly utilized in scientific computing, data analysis, and machine learning.
It is often used in combination with NumPy and SciPy to create visualizations of data sets.
5. Seaborn – for advanced data visualization
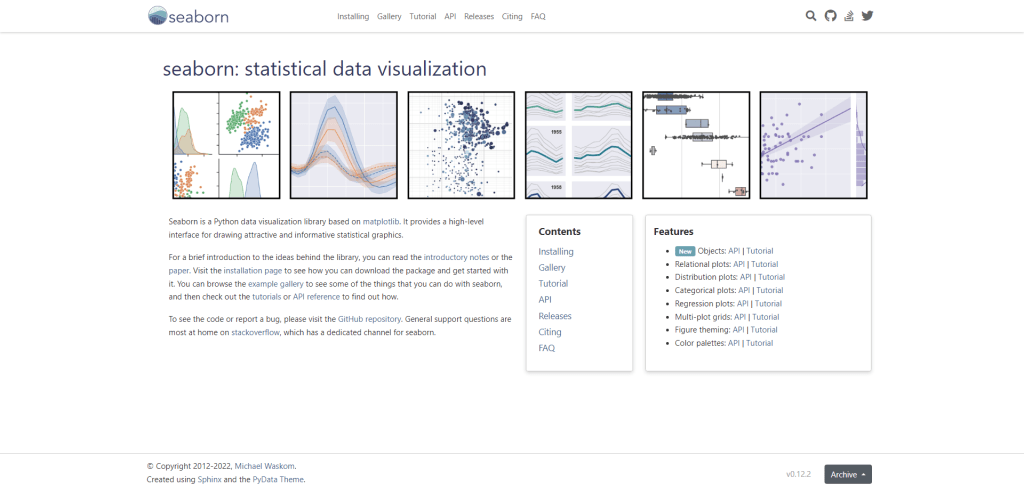
Seaborn is a Python data visualization library based on matplotlib. It provides a high-level interface for creating attractive and informative statistical graphics. Seaborn makes it easy to create a wide variety of visualization types, such as scatter plots, line plots, heat maps, bar plots, and more.
Seaborn’s key strength is in its ability to create complex visualizations with relatively few lines of code. It also provides several advanced features, including color palettes, data transformations, and statistical models.
- Attractive default styles: Seaborn provides a variety of built-in color palettes and plot styles that make it easy to create beautiful and professional-looking visualizations with just a few lines of code.
- Easy data exploration: Seaborn makes it easy to explore and understand your data by providing a variety of functions for visualizing data distributions, relationships between variables, and more.
- Advanced visualizations: Seaborn provides a range of advanced visualization functions, including heatmaps, cluster maps, and regression plots, that can help you gain insights into complex datasets.
- Integration with Pandas: Seaborn is designed to work seamlessly with Pandas. This makes it easy to visualize data stored in Pandas DataFrames.
- Customizability: Seaborn is highly customizable, allowing you to adjust plot features such as colors, axis labels, and font sizes to suit your needs.
Seaborn is commonly used for exploratory data analysis, as well as for creating visualizations for publication or presentation. It is particularly useful for visualizing complex relationships between multiple variables, as well as for creating visually appealing graphics that can be easily customized to meet specific requirements.
Some common use cases for Seaborn include visualizing data distributions, creating heatmaps and cluster maps, and visualizing regression models.
6. statsmodels – for statistical analysis
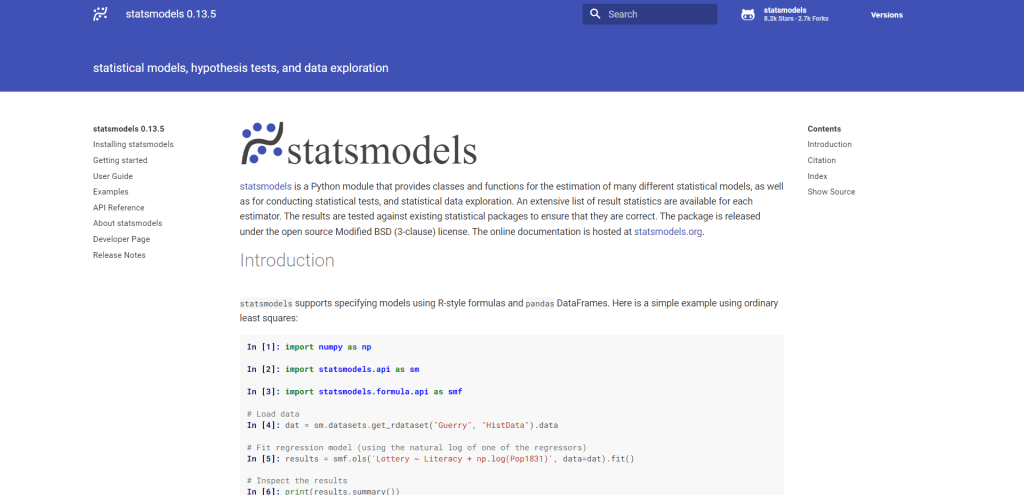
Statsmodels is a library for statistical modeling and analysis that provides a wide range of tools for data exploration, modeling, and inference. It includes a comprehensive set of regression models, time series analysis tools, hypothesis testing, and statistical visualization capabilities. With Statsmodels, you can easily estimate and interpret complex statistical models using a simple and intuitive API.
Key features
- A wide range of statistical models and tools for regression analysis, time series analysis, and hypothesis testing.
- Built-in support for linear regression, generalized linear models, mixed-effects models, robust regression, and many more.
- A flexible framework for modeling time series data, including ARIMA, SARIMAX, VAR, and state space models.
- Hypothesis testing capabilities for t-tests, ANOVA, and other statistical tests.
- Extensive support for statistical visualization, including time series plots, residual plots, and diagnostic plots for model evaluation.
- Built-in data processing and transformation tools, including tools for handling missing data, outlier detection, and data preprocessing.
- Integration with other Python data analysis libraries, such as pandas and matplotlib.
It is widely used by researchers, data scientists, and analysts to perform statistical analysis and build predictive models in Python.
7. Bokeh – for interactive visualization
Bokeh is an actively maintained library used to create interactive and dynamic visualizations for modern web browsers. It is particularly well-suited for creating complex and large-scale visualizations with ease. Bokeh provides a wide variety of visualization types, including scatter plots, line charts, bar plots, heatmaps, and more, as well as a flexible and customizable API for creating custom plots.
One of Bokeh’s main features is its ability to generate interactive plots that respond to user input. Bokeh provides a range of built-in tools and widgets to create interactive features such as zooming, panning, hovering and selecting. Bokeh also provides a platform for creating custom widgets that allow users to interact with data and dynamically update plots.
The library is designed to work seamlessly with other Python data libraries such as Pandas, NumPy, and Scikit-learn, making it easy to incorporate into existing workflows. It also has strong integration with Jupyter notebooks, allowing for interactive data exploration and visualization within the notebook environment.
8. Plotly – for 3D visualization
Plotly is a dynamic data visualization library for Python that empowers users to create interactive and publication-ready graphs, charts, and dashboards. Its straightforward syntax enables users to rapidly and efficiently generate visualizations for various data science applications, from exploratory data analysis to presenting insights in reports and presentations.
Key features
- Interactivity: Create interactive visualizations that enable users to zoom, pan, and get more information by hovering over different elements in the chart.
- Publication-quality charts: Styling options and themes that allow users to create visually appealing and publication-quality charts.
- Comprehensive chart types: A wide range of chart types, including scatter plots, line charts, bar charts, pie charts, heatmaps, and more.
- Multi-platform support: Can be used in multiple programming languages, including Python, R, MATLAB, and JavaScript.
- Integration with other data science libraries: Plotly integrates with other popular data science libraries in Python, including Pandas, NumPy, and Scikit-Learn, to facilitate data exploration and analysis.
- Dashboard creation: Plotly also offers a dashboard creation feature, allowing users to create and publish interactive dashboards.
One of the distinctive aspects of Plotly is its capacity to generate interactive visualizations, which can be personalized with an extensive range of styling options and pre-built widgets such as hover information, zooming, and panning. Furthermore, Plotly supports multiple data structures and types, making it an ideal tool for different data sources, such as time-series, geospatial, and network data.
9. scikit-learn – for Machine Learning
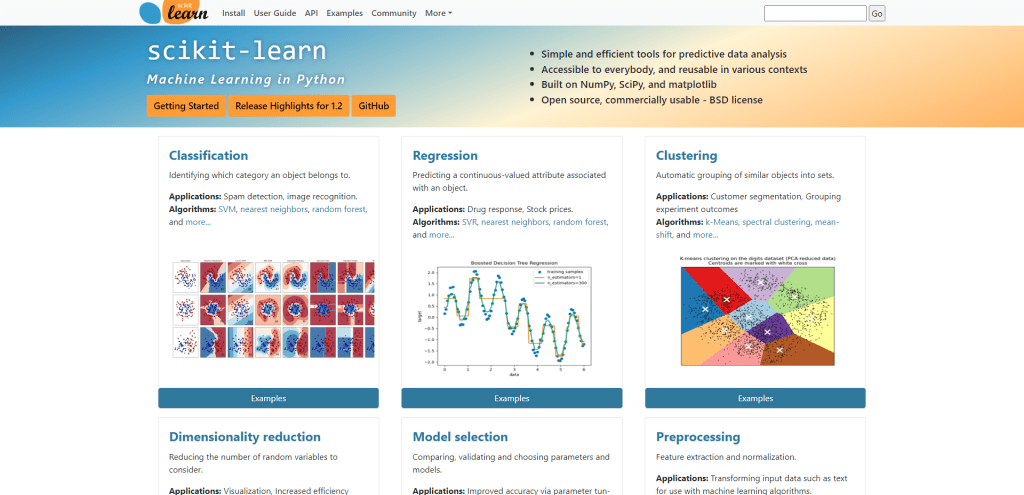
Scikit-learn is a popular machine learning library for Python. It provides a comprehensive set of tools for data preprocessing, feature selection, model selection, and performance evaluation. The library includes a wide range of algorithms for classification, regression, clustering, and dimensionality reduction, and supports both supervised and unsupervised learning.
Key features
- Comprehensive set of tools for data preprocessing, feature selection, model selection, and performance evaluation.
- Wide range of algorithms for classification, regression, clustering, and dimensionality reduction.
- Support for both supervised and unsupervised learning.
- Clear and intuitive API enables users to build and test machine learning models quickly.
- Easy integration with other Python libraries such as NumPy, Pandas, and Matplotlib.
- Robust documentation and an active user community that provide resources and support for users of all skill levels.
With its clear and intuitive API, scikit-learn enables users to quickly build and test machine learning models, making it a valuable tool for both beginners and experts in the field.
Summary
Python libraries have completely transformed how we handle, analyze, and visualize data in science and analysis. These libraries, including NumPy, Pandas, matplotlib, and Scikit-learn, have become essential tools for data scientists and analysts across multiple industries.
One of the primary reasons for the popularity of these libraries is their ease of use and the vast array of functions they offer. They provide efficient and effective solutions for data analysis, allowing researchers and analysts to obtain valuable insights that can drive informed decisions in business and research.
As Python continues to gain popularity as a programming language, the development and updates to these libraries only continue to enhance their features and capabilities. This means that they remain at the forefront of the data analysis and science field, offering cutting-edge solutions for researchers and analysts to make sense of complex data.
Whether you’re an experienced data analyst or new to the field, these libraries provide a solid platform for working with data. The extensive documentation and online support available make them accessible to anyone looking to explore the world of data analysis and science.